Viewing the Pipeline Report
Qwilr's pipeline report helps you measure how quickly your deals move through the sales pipeline.
Let us start by painting a picture, you’re trying to figure out how fast your deals are moving through your pipeline and bringing in revenue in the simplest, most accurate way.
That’s where sales velocity comes into play. It’s a great way to track how quickly things are progressing, and let’s be honest, the faster your sales velocity, the quicker you’re going to see that revenue come in. If you want to dive deeper into why this is so important, take a look at our blog post for more insights.
In this article:
- How to calculate sales velocity?
- What data can you find in the Pipeline report?
- Using the Pipeline Report
- Report default settings (separate article)
How to calculate sales velocity
- Number of Opportunities – How many deals are in your pipeline?
- Average Deal Value – What’s the average value of those deals?
- Win Rate – How often are you closing deals?
- Length of the Sales Cycle – How long does it take for a deal to move from start to finish?
When you pull all this together, you get your sales velocity.
Here's what the formula looks like:

What data can you find in the Pipeline report?
So, what does all this look like in action?
With Qwilr Pipeline reports, you can get a snapshot of your sales velocity along with a bunch of other insights that help you understand your deals better. Here’s what’s included:
- A quick sales velocity summary (and how it’s trending over time)
- Your Qwilr page funnel (broken down by both page count and value)
- Status transitions of your Qwilr pages (again, by both page count and value)
- Sales velocity history related to how long your deals have been in the pipeline
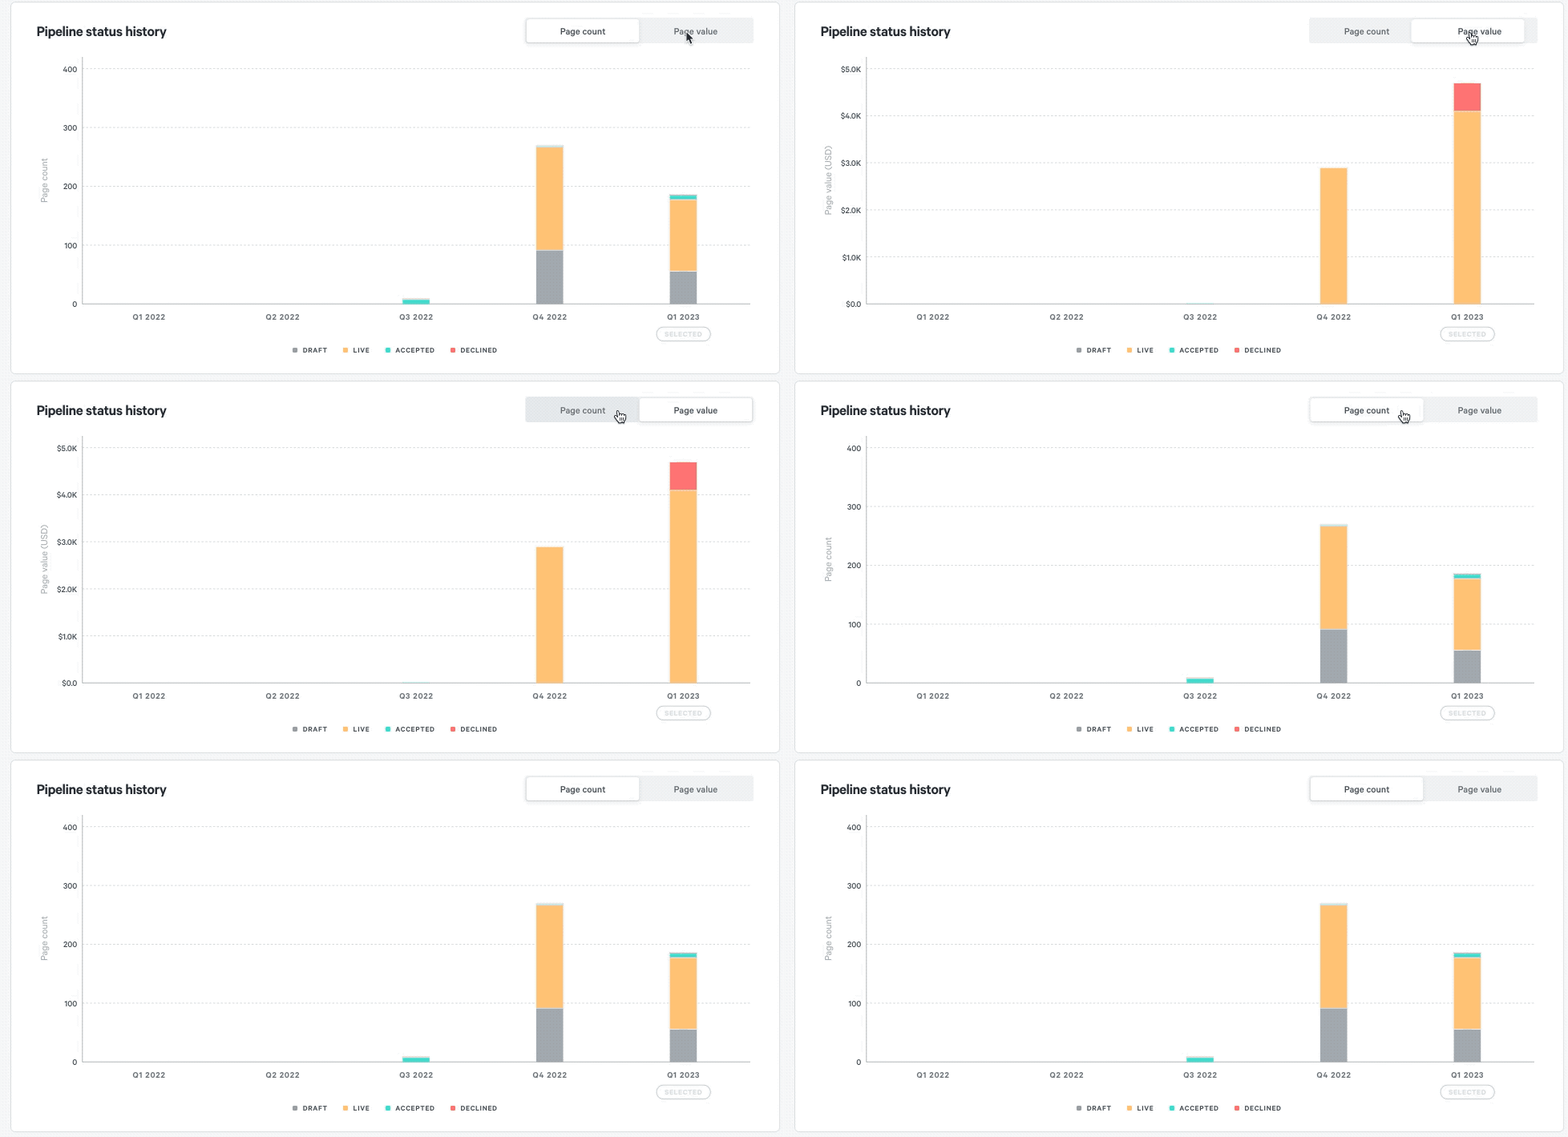
- Your pipeline status history showing where deals are at in the process


Plus, you can filter your data in a bunch of useful ways:
- Time: Week, month, quarter, or year
- Team members: See your own data, or if you’re an admin, get an overview of your whole team’s
- Currency: Keep everything in your preferred currency
- Page types: Filter by pages with certain blocks (quote, accept, etc.), set values, templates, or tags
Using the Pipeline Report
Step 1. Head to the Reports section on your Dashboard on the upper left corner.

Step 2. Select the time period you're interested in: week, month, quarter or year. You can easily change this later to view data for different time ranges.

This is how we calculate sales status history and funnel metrics across different time periods:
Funnel / Status Report: Reflects data for the current period (week, month, or quarter):
- Weekly: Data for the current week (e.g., October 13 to October 19, 2024).
- Monthly: Data for the current month (e.g., October 1 to October 31, 2024).
- Quarterly: Data for the current quarter (e.g., October 1 to December 31, 2024).
History Reports (Sales Velocity & Pipeline Status): Aggregates data for the period prior to the current reporting period.
- Weekly: Covers the 6 weeks leading up to the current week.
- Monthly: Covers the 6 months leading up to the current month.
- Quarterly: Covers the 12 months prior to the current quarter, divided into quarters.
Important note: The History Reports do not overlap with the Funnel/Status Report. For instance, if you select Quarterly on December 11, 2024:
The Funnel/Status Report covers October 1-December 31, 2024.
The History Report covers October 1, 2023-October 1, 2024.
Step 3. Select the currency you want to view. The report will filter your data - showing only pages with the selected currency.

Note: You can set a default currency for your pipeline reports via your Account Settings > Analytics & Reporting.
Step 4. Then you can also select in "Saved filters" the data you want to review:

Note: Only admins on an account are able to view other individual's report data. If you are not an admin on the account you have access to your own pipeline data and an aggregate of all pipeline data in your team's account (but not to individual's pipeline data, other than your own).
Step 5. Under Saved Filter select the type of Pages you'd like to include in your report:

Note: A Saved filter is a group of pages with predefined filters that allows you to view your pipeline by different use cases.
Step 6. Lastly, click Clean Up if you'd like to exclude pages that haven't been edited for a number of days prior to the period you are reviewing. Select the number of days you want to apply from the drop-down. This action is to keep old and 'not so relevant' pages out of your reports and make sure you're only viewing data that makes the most sense to your pipeline.

Note: For accurate information, make sure to set up your time zone via yourAccount Settings > Analytics & Reporting.
Step 6. Explore the data by applying the various filters:


Got questions? Reach out to the team at help@qwilr.com
